Tiếng Việt
1. What is the Pearson Correlation Coefficient?
The Pearson correlation coefficient, often denoted as r, is a statistical measure that quantifies the strength and direction of the linear relationship between two variables. It ranges from -1 to +1, where:
-
+1 indicates a perfect positive linear relationship (as one variable increases, the other increases proportionally).
-
-1 indicates a perfect negative linear relationship (as one variable increases, the other decreases proportionally).
-
0 indicates no linear relationship between the variables.
In the context of Bitcoin, the Pearson correlation coefficient can be used to analyze relationships between BTC's price and other variables, such as the price of altcoins, trading volume, or external factors like stock market indices or gold prices.
2. Applications of Pearson Correlation in Bitcoin Analysis
.jpg)
The Pearson correlation coefficient is widely used in cryptocurrency analysis to uncover relationships that can inform trading strategies, risk management, and market predictions. Below are some key applications:
2.1. Correlation Between BTC and Altcoins
Bitcoin often serves as a market leader in the cryptocurrency space, influencing the price movements of altcoins like Ethereum, Ripple (XRP), or Cardano (ADA). By calculating the Pearson correlation coefficient between BTC and altcoin prices, analysts can determine whether these assets move in tandem. For instance:
-
A high positive correlation (e.g., (r = 0.8)) between BTC and ETH suggests that when BTC's price rises, ETH's price is likely to rise as well.
-
A low or negative correlation might indicate that an altcoin is less dependent on BTC's market movements, potentially offering diversification benefits.
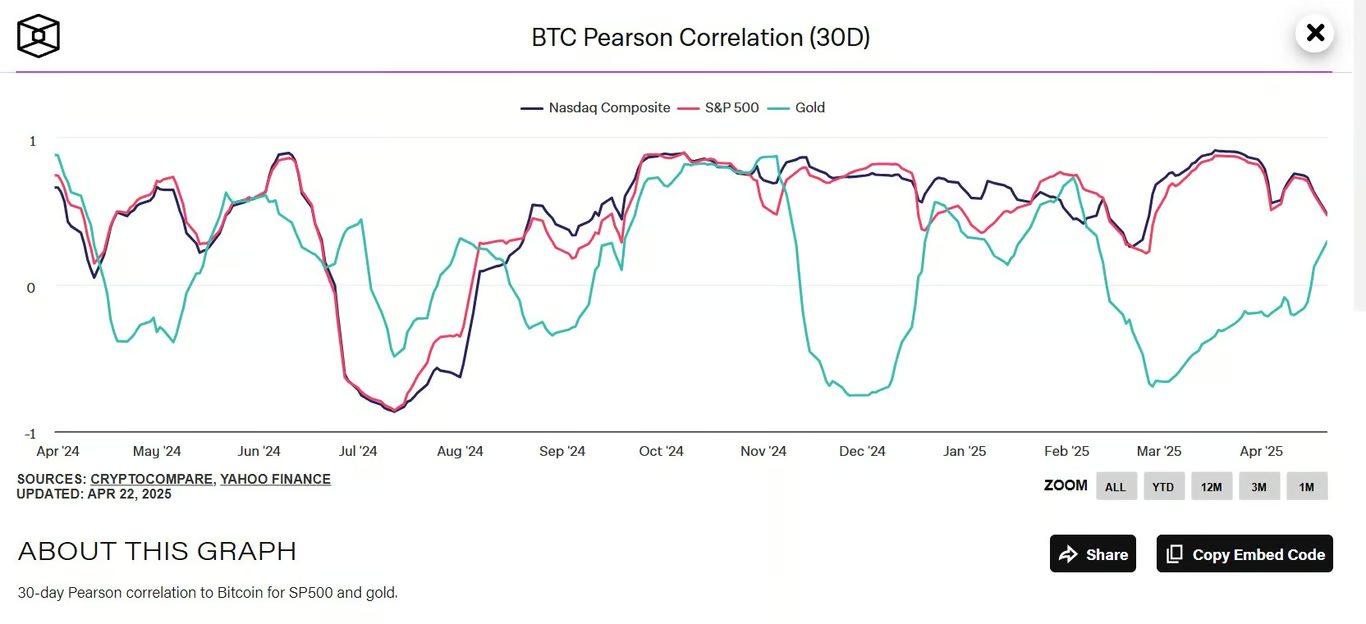
2.2. BTC and Traditional Markets
Investors often explore whether BTC behaves as a "safe haven" asset, similar to gold, or moves in sync with traditional markets like the S&P 500. The Pearson correlation coefficient can quantify these relationships. For example:
-
During periods of economic uncertainty, analysts might calculate the correlation between BTC and gold prices to assess whether BTC acts as a hedge.
-
A negative correlation between BTC and the U.S. dollar index (DXY) could suggest that BTC strengthens when the dollar weakens.
2.3. BTC Price and Trading Volume
Trading volume is a key indicator of market activity. A positive correlation between BTC price and trading volume might indicate that price increases are driven by heightened market interest. Conversely, a low correlation could suggest that price movements are driven by factors other than volume, such as news events or whale activity.
2.4. Sentiment Analysis
Market sentiment, often derived from social media platforms like X or news articles, can influence BTC's price. By quantifying sentiment scores (e.g., positive or negative sentiment) and correlating them with BTC price, analysts can assess whether public perception drives market trends.
3. Interpreting Pearson Correlation Results
When interpreting the Pearson correlation coefficient, it’s important to consider both the magnitude and direction of the value:
-
0.00 to 0.19: Very weak correlation.
-
0.20 to 0.39: Weak correlation.
-
0.40 to 0.59: Moderate correlation.
-
0.60 to 0.79: Strong correlation.
-
0.80 to 1.00: Very strong correlation.
The sign (+ or -) indicates whether the relationship is positive or negative. For example, a correlation of (r = -0.65) between BTC and the DXY suggests a strong negative relationship, meaning that as the dollar strengthens, BTC’s price tends to decline.
4. Limitations of Pearson Correlation in BTC Analysis
While the Pearson correlation coefficient is a powerful tool, it has limitations that analysts must consider:
- Assumes Linear Relationships: The Pearson correlation coefficient only measures linear relationships. In the volatile and complex cryptocurrency market, relationships between variables may be non-linear. For example, BTC’s price might have a non-linear relationship with trading volume during extreme market conditions.
- Correlation Does Not Imply Causation: A high correlation between two variables does not mean that one causes the other. For instance, a strong correlation between BTC and ETH prices might be due to a third factor, such as overall market sentiment, rather than a direct causal relationship.
- Sensitivity to Outliers: The Pearson correlation coefficient is sensitive to outliers, which are common in cryptocurrency data due to sudden price spikes or crashes. A single extreme event (e.g., a flash crash) can skew the correlation value.
- Timeframe Dependency: Correlation values can vary significantly depending on the timeframe analyzed. For example, BTC and ETH might show a strong correlation over a 30-day period but a weak correlation over a 1-year period. Analysts must choose appropriate timeframes based on their objectives.
- Market Dynamics: The cryptocurrency market is influenced by unique factors, such as regulatory news, technological developments, or whale activity, which may not be captured by simple correlation analysis. These factors can disrupt otherwise stable relationships.
5. Tools for Calculating Pearson Correlation
Analysts can calculate the Pearson correlation coefficient using various tools:
-
Programming Languages: Python (with libraries like NumPy or pandas) and R are popular for correlation analysis.
-
Spreadsheets: Microsoft Excel or Google Sheets offer built-in functions (e.g., CORREL in Excel) for quick calculations.
-
Trading Platforms: Some platforms, like TradingView, provide correlation analysis tools for cryptocurrencies.
6. Conclusion
The Pearson correlation coefficient is a valuable tool for analyzing relationships in the Bitcoin market, offering insights into price movements, market dynamics, and potential diversification opportunities. By quantifying the strength and direction of linear relationships, it helps traders and investors make informed decisions. However, its limitations—such as its focus on linear relationships and sensitivity to outliers—require careful interpretation and complementary analyses. As the cryptocurrency market continues to evolve, combining the Pearson correlation coefficient with other statistical and machine learning techniques will enhance our understanding of Bitcoin’s complex behavior.
Read more: